


Editor’s note: This article is Part 3 of a three-part introduction to Python in Excel, detailing its functionality and application for data analysis — a highly relevant skill for today’s accounting and finance professionals. Part 1 provides an overview of the topic and details how Python code may be inserted into Excel. Part 2 looks at working with lists, extending this with dynamic arrays, and how Python works with Excel data sources such as an Excel Table and a Power Query Table.
This third article in the series is split into two sections:
- New errors required: With new functionality come new errors. This section revisits examples already cited — and provides more.
- More-complex examples: Whilst the examples provided so far have used very simple Python syntax, this section considers more complex and useful programs, using imported libraries and modules.
New errors required
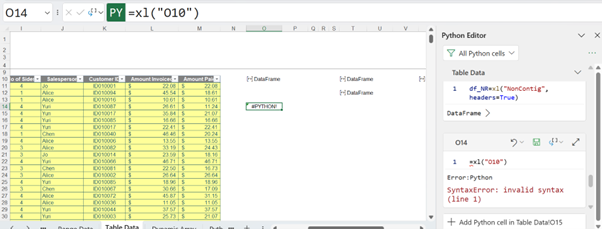
Of course, with new functionality come new errors. A couple of these have been encountered already, but there are more. For example, whilst getting to grips with the Python syntax, mistakes may occur, like this one:
=xl(“O10”)
This will return a new error: #PYTHON!
These are some of the other common errors that may be encountered:
- #BLOCKED!
This can occur if Python in Excel is not available for the user opening a workbook containing Python formulae.
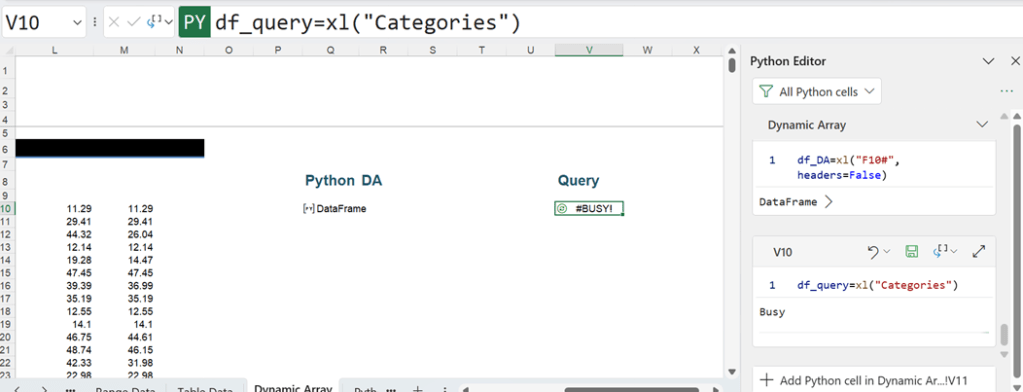
- #BUSY!
This means Python calculations are running in the Microsoft Cloud.
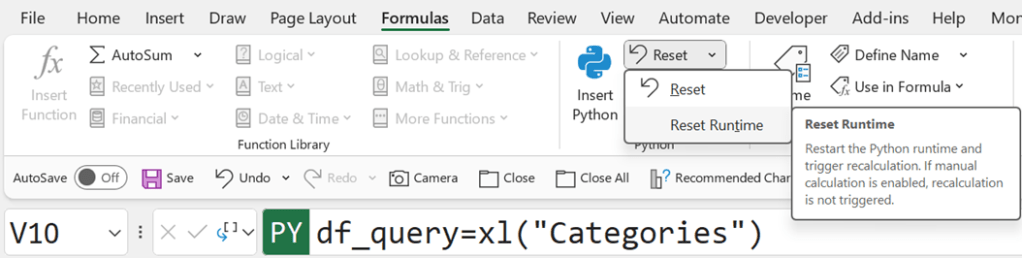
If the #BUSY! error displays for longer than a minute, Microsoft recommends resetting the Python runtime. To do this, on the Formulas tab, select Python and then Reset Runtime (keyboard shortcut CTRL+ALT+SHIFT+F9).
- #CALC!
This will be encountered if you are trying to run a calculation with more than 100 MB of data.
- #CONNECT!
This indicates an issue with the communications with the cloud. Follow the same procedure as for the #BUSY! error.
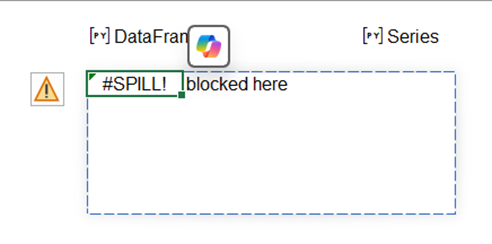
- #SPILL!
As for dynamic arrays, this occurs when a cell in the Python output range (when expressed as an Excel value) already contains data.
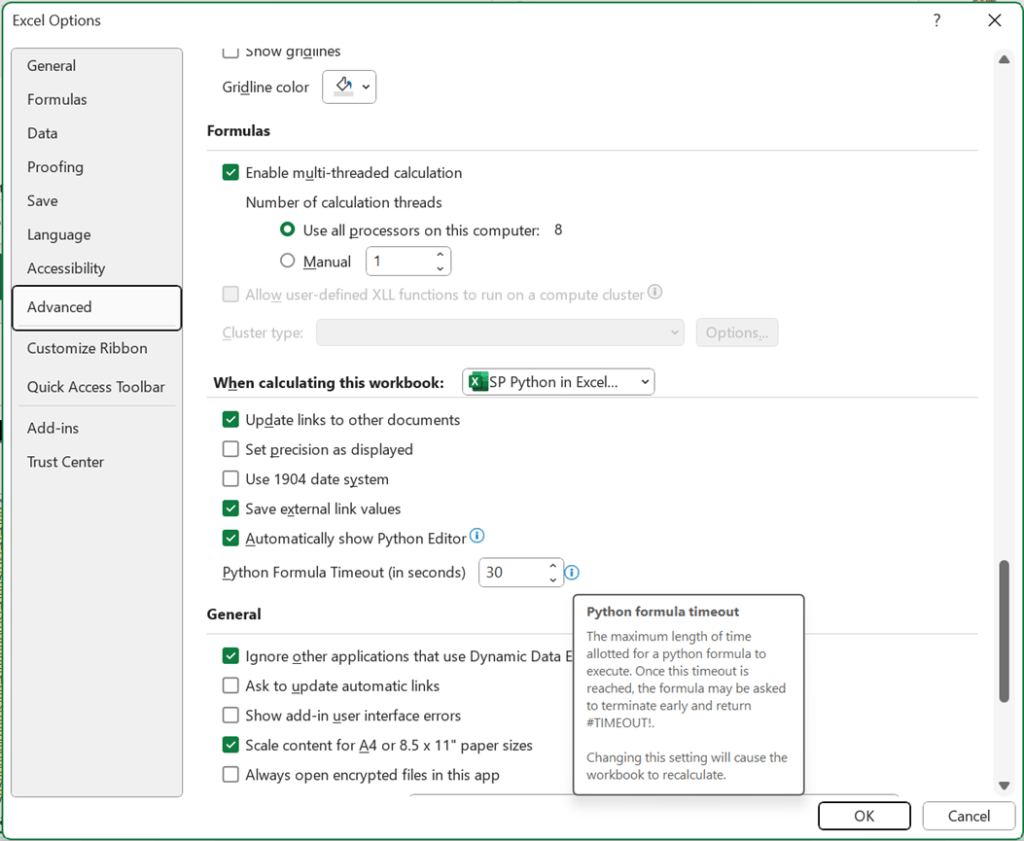
- #TIMEOUT!
This means that the maximum allotted execution time has been exceeded.
If this error is repeatable, follow the same procedure as for the #BUSY! error. If it persists, consider adjusting the Python timeout limit as shown below:
- #UNKNOWN!
The #UNKNOWN! error in a Python cell means that the user opening the workbook does not have Python in Excel enabled.
More-complex examples
The examples so far have used very simple Python syntax. A practical way to create more-complex and useful programs is to import libraries and modules. At the time of this writing, since Python in Excel uses Anaconda Distribution for Python, the libraries available are those supported by Anaconda. These include Pandas and Matplotlib, though, as explained earlier, these are already installed. The Python syntax to install a library is usually (see the warning below) as follows:
import LibraryName as YourName
where LibraryName is the name that Python recognises, and YourName is the name you wish to use to refer to the library.
For example, the Matplotlib library may be imported:
import matplotlib as mpl
However, since only the pyplot module of Matplotlib may be required, currently, the Initialization tab shows that the following syntax has been used:
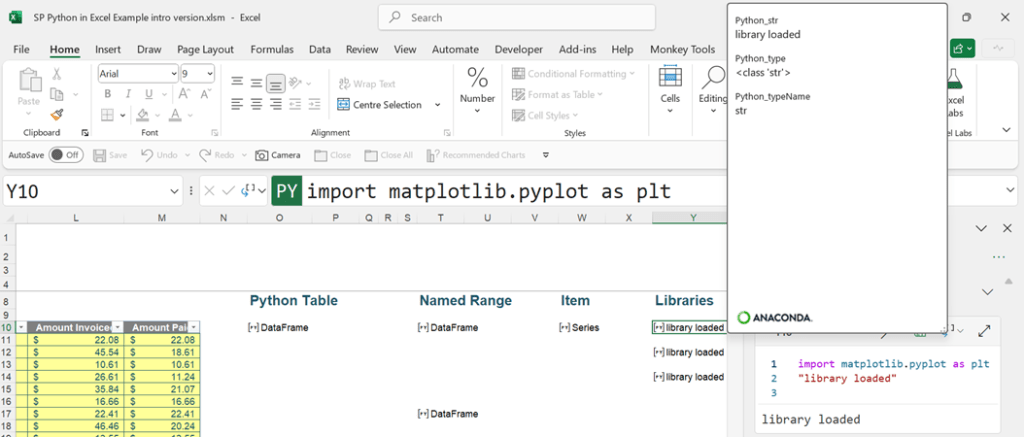
import matplotlib.pyplot as plt
If the code above is run, the cell that the command is run from will be left blank. To see that the library has loaded, a line should be added (remembering not to use the print() command with Excel):
import matplotlib.pyplot as plt
“library loaded”
The text “library loaded” will then appear in the cell:
The installed libraries may be used to access more Python syntax. Pandas allows the use of the function
DataFrameName.describe()
to analyse the contents of the DataFrame identified by DataFrameName. When referencing a DataFrame in a second DataFrame, either the name or the cell reference containing the DataFrame may be used, and the same principle applies here.
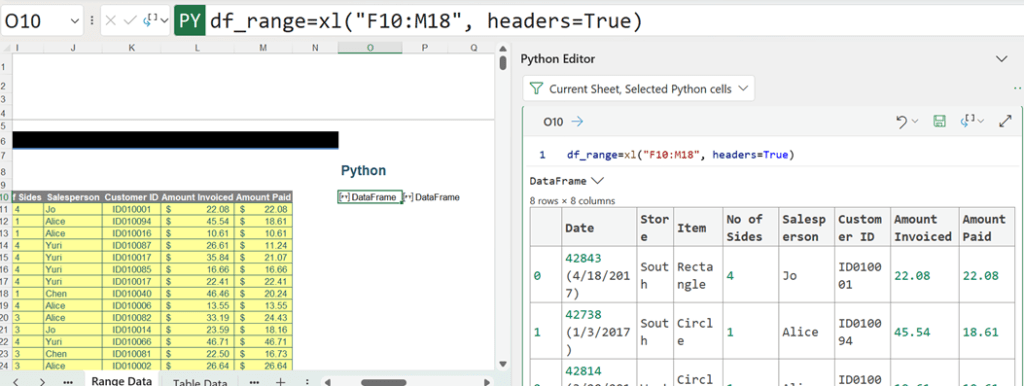
This example uses the Range Data sheet, where the DataFrame df_range is being analysed:
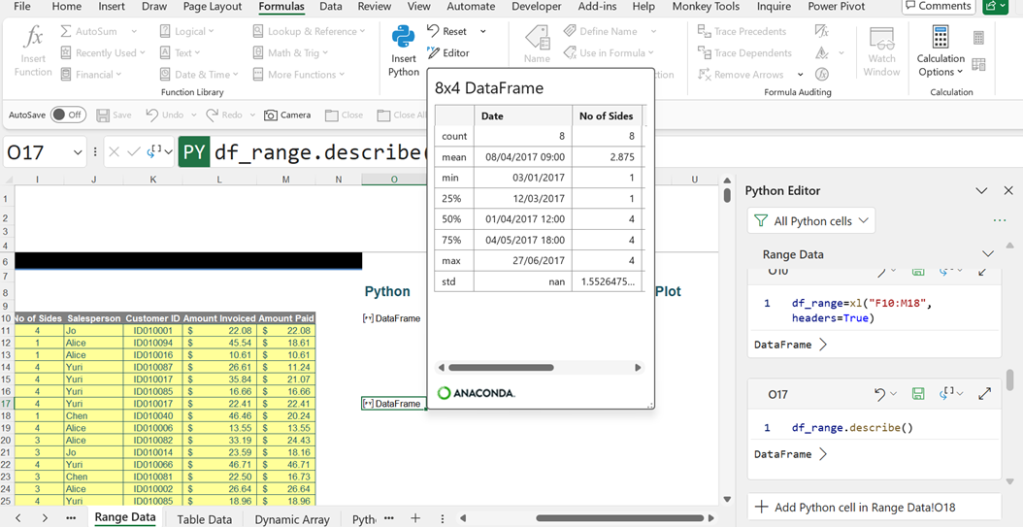
The Python syntax used is:
df_range.describe()
This Python code would give the same result:
xl(“O10”).describe()
since the cell O10 contains the DataFrame df_range.
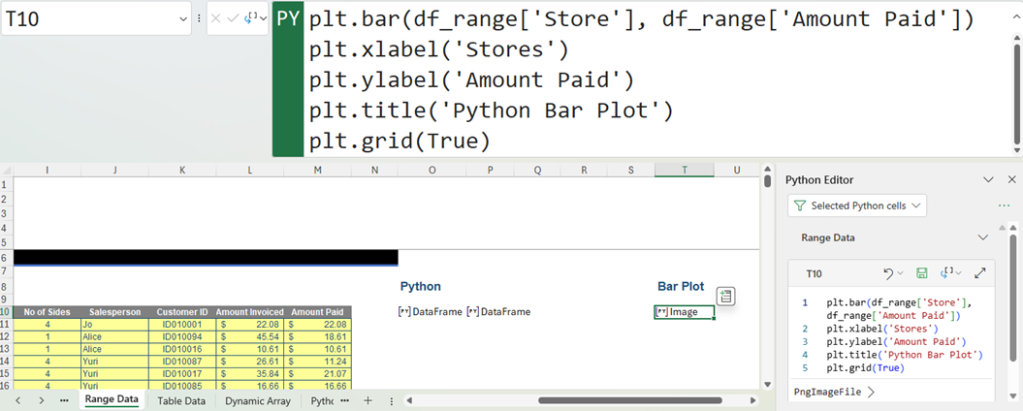
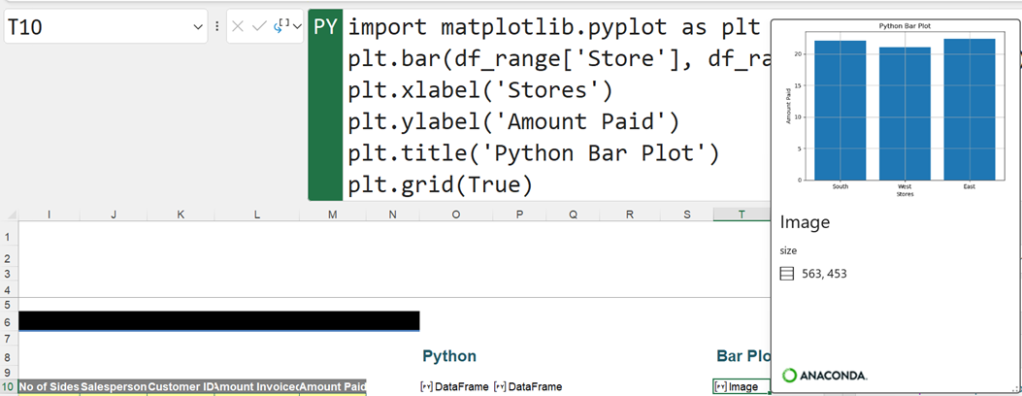
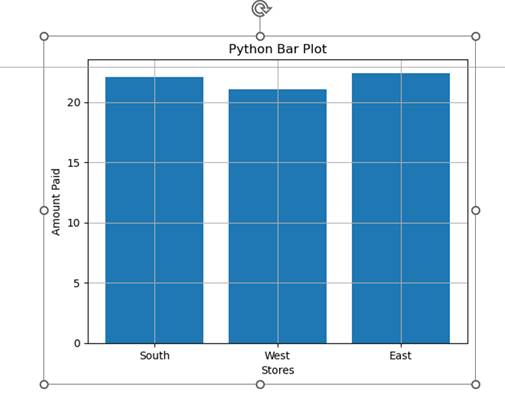
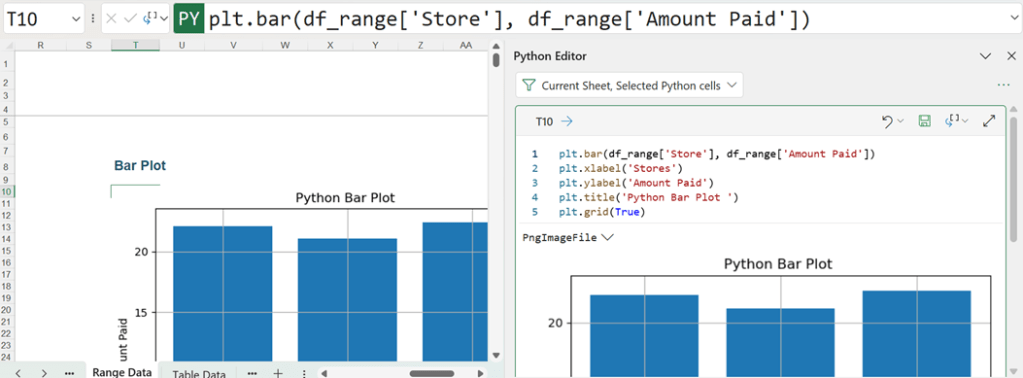
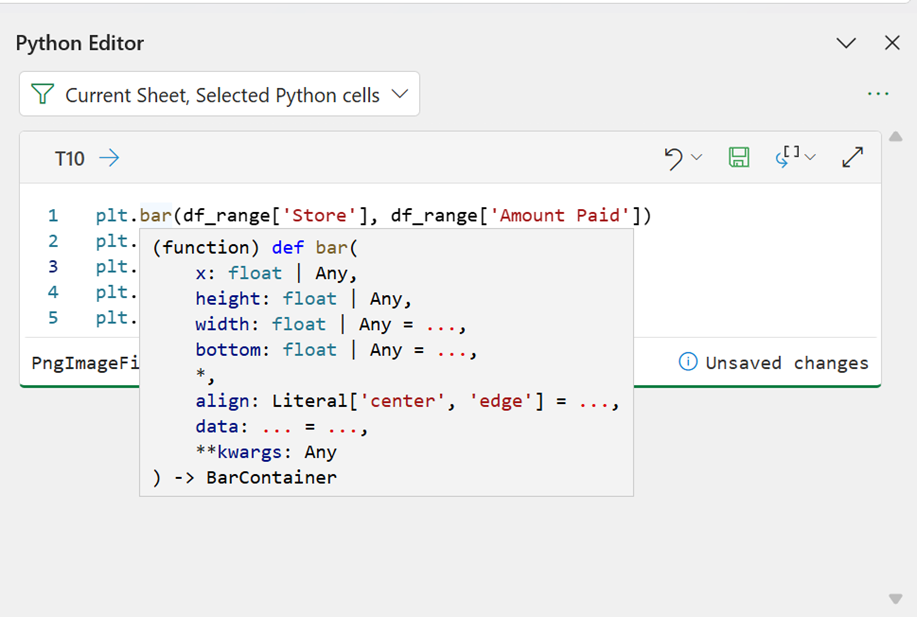
Moving on to the functionality available in Matplotlib (given the name plt), a Python chart may be created. The Python syntax to create a bar plot is:
plt.bar(df_range[‘Store’], df_range[‘Amount Paid’])
It is also possible to add some features:
- Labels for the axes.
- A title for the bar plot.
- Include grid lines.
To achieve this, the Python code should be extended to:
plt.bar(df_range[‘Store’], df_range[‘Amount Paid’])
plt.xlabel(‘Stores’)
plt.ylabel(‘Amount Paid’)
plt.title(‘Python Bar Plot’)
plt.grid(True)
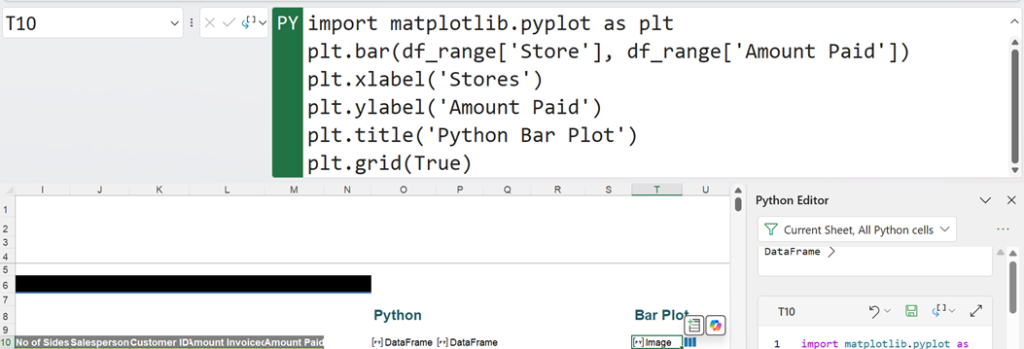
This creates the bar plot in one cell. Instead of a DataFrame, this has resulted in an Image object:
To view a preview of the bar plot, right-click the cell and select Show Data Type Card:
To see the bar plot in the workbook, it is possible to toggle between the Python and Excel output.
Since a single cell is not appropriate for showing any detail, the chart could be displayed by merging cells. However, another way to enlarge the image is by right-clicking on it and then selecting Display Plot over Cells:
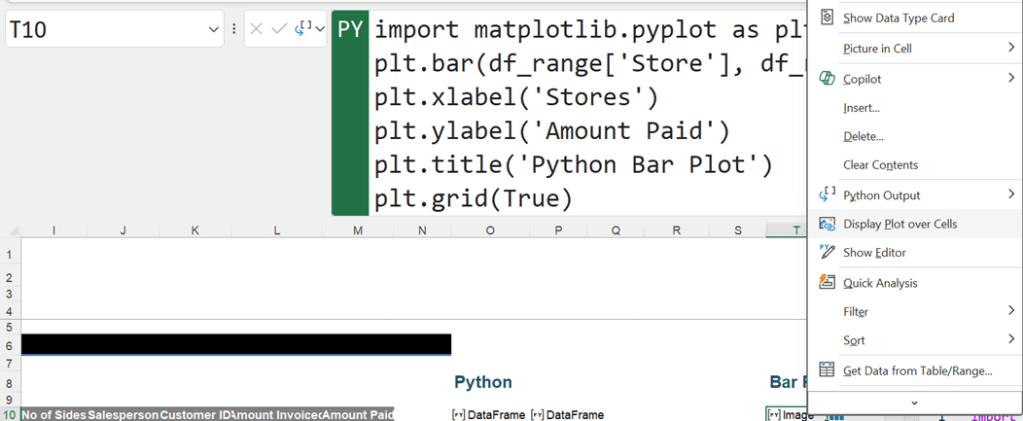
This creates a floating image object that may be selected and dragged to move it to a new position in the worksheet. The nodes at the corners and sides of the image may also be dragged in order to resize.
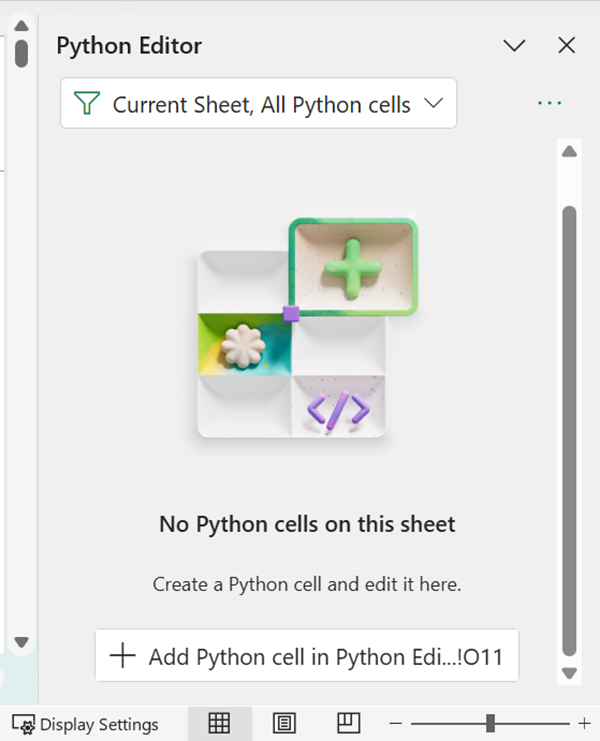
Although the examples so far have used the Formula bar, it is also possible to enter Python code into the cell using the Python Editor. If the Python Editor is accessed in a sheet with no Python cells, and the filter is set to show Current Sheet, All Python cells, there will only be the option to enter code into the currently selected cell:
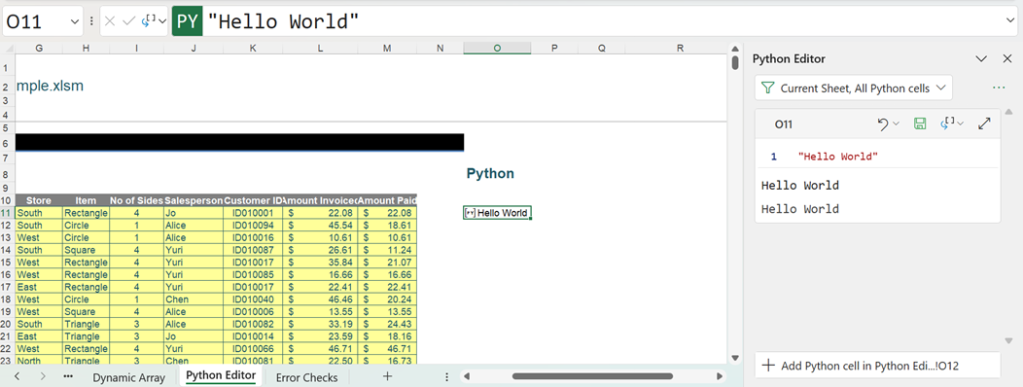
The first example created may be viewed here, where the Python code entered was
print(“Hello World”)
Note that since the code is entered into the editor, the equals (=) sign needed in the Formula bar is not required here. To begin entering code into cell O11, we enter “print(” (this will automatically be “completed” with the closed bracket as well):
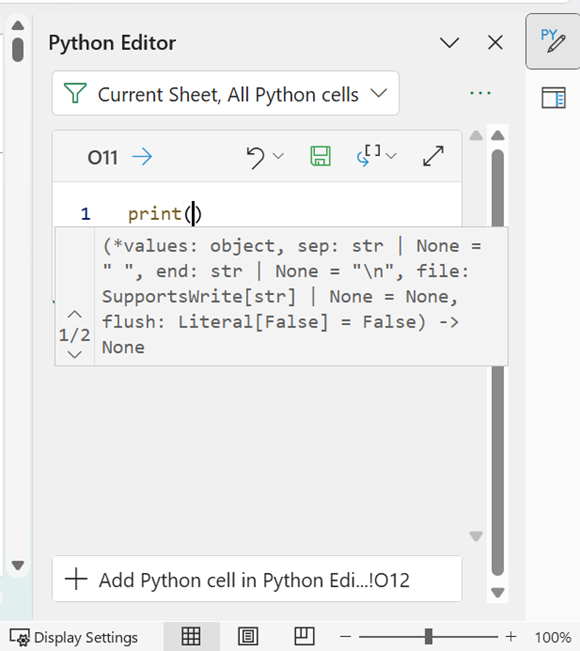
One of the advantages of using this method is that more syntax help is automatically provided. Longer sections of code may be more easily viewed and entered using the expanded section:
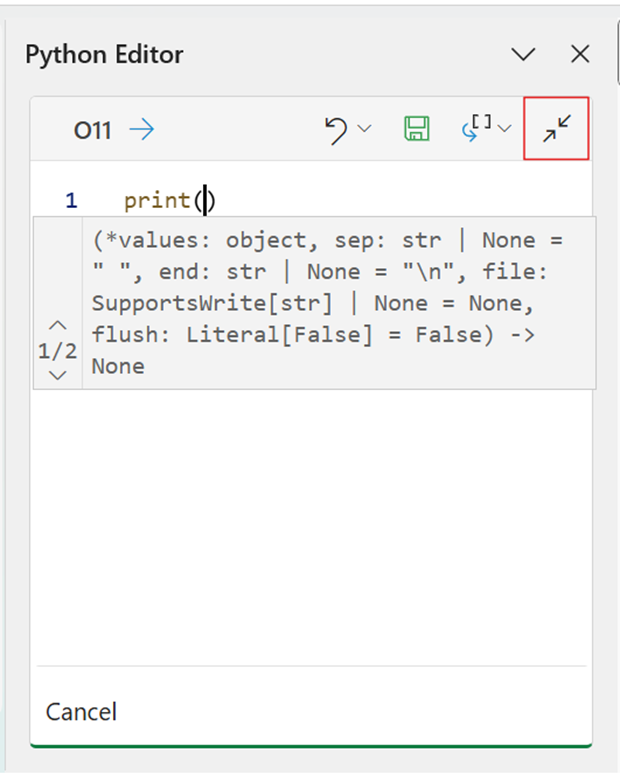
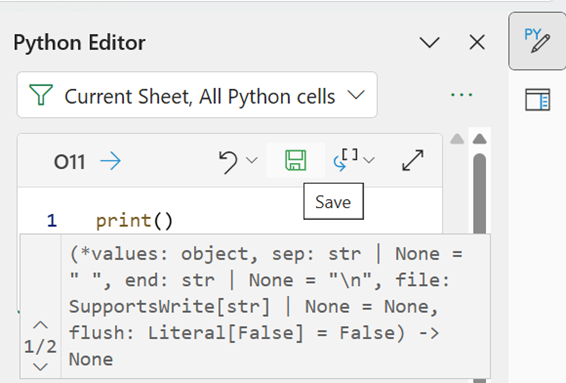
The button highlighted on the previous image may be used to toggle between the expanded and contracted sections. Before using CTRL+ENTER to execute the code, there is a Save button to save the code prior to execution:
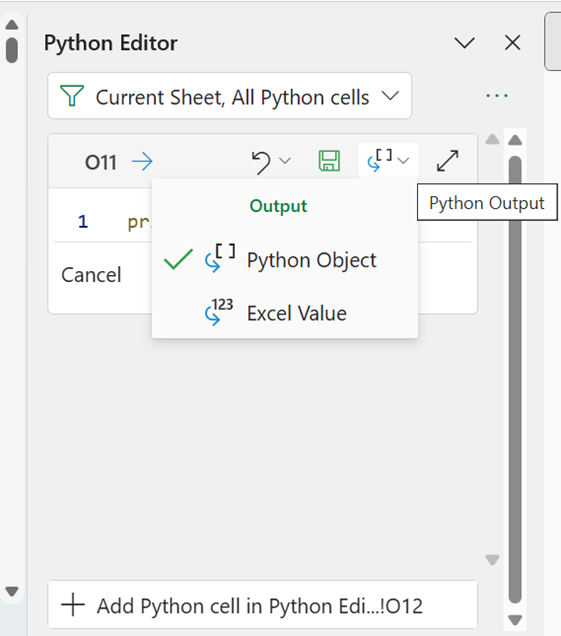
The Output dropdown allows the choice between the Python Object and the Excel Value as shown below:
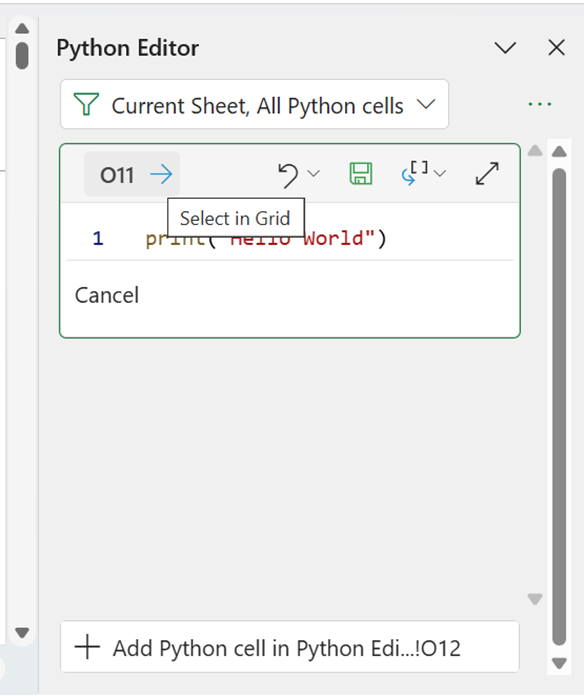
There is also an option to Select in Grid, which selects the current cell in the workbook.
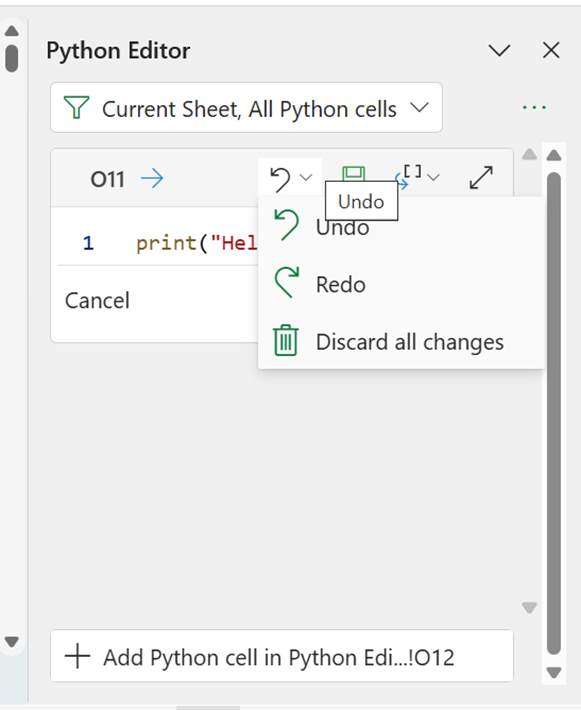
There is a Discard all changes option on the dropdown menu from the Undo icon:
Once the code is ready, CTRL+ENTER is used to run the code, and the results are similar to the Formula bar method.
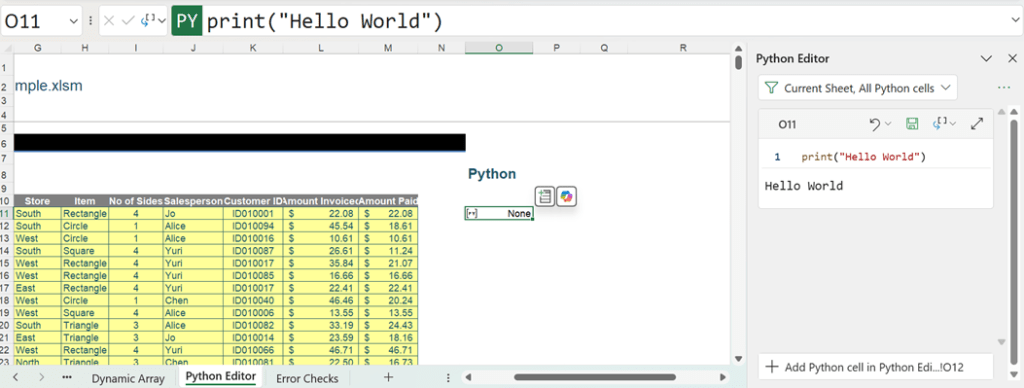
For the same reason as with the Formula bar method, if the Print() command is omitted, the output appears in the cell:
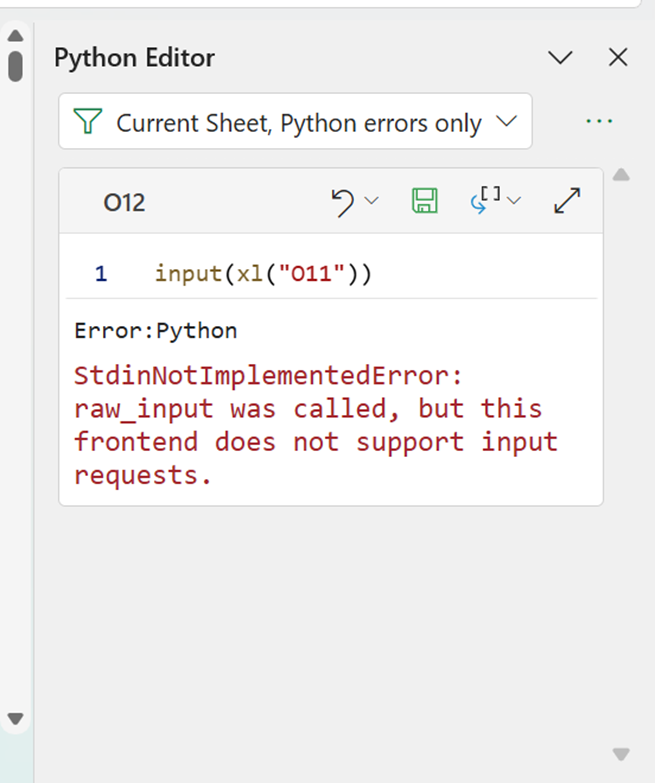
If an unrecognised entry, which is not Python code, is entered in cell O12:
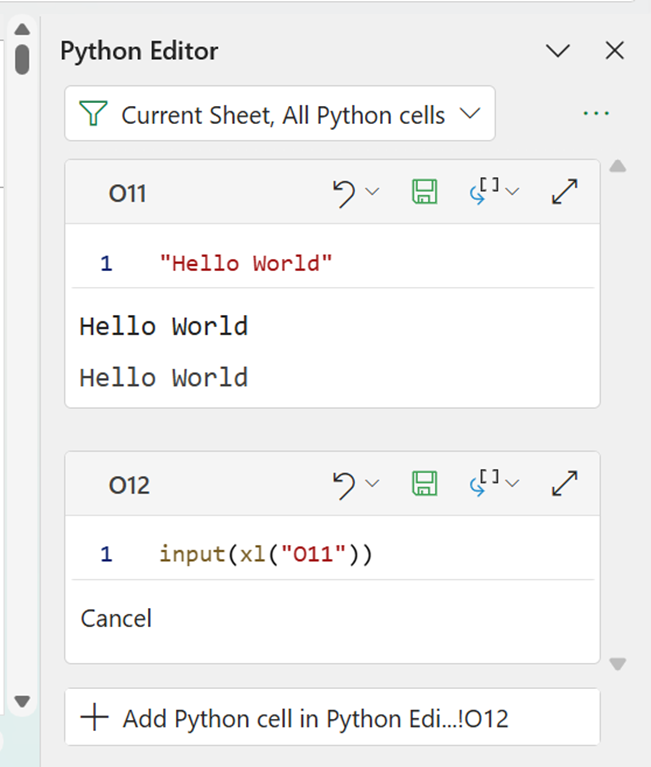
Although input() is not recognised by the Excel frontend, it is accepted as syntax. When it is committed using CTRL+ENTER, the following results occur:
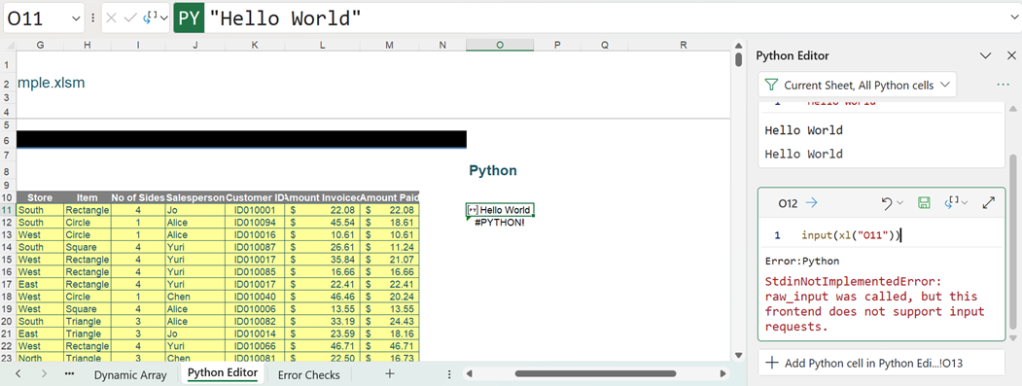
This is the same error as the one encountered in the Formula bar method of creation. We are currently filtering by current worksheet, but there are other ways to filter the cells shown in the Python Editor tab:
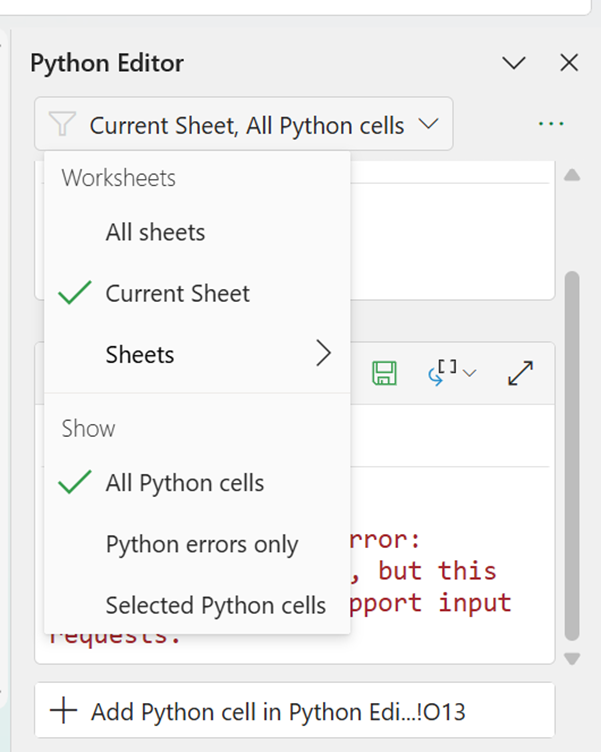
Choosing to show Python errors only shows the input() error but not the print() issue, as that is not strictly an error — as shown below:
Selected Python cells will show any cells currently selected in the workbook, in this case O11:

Different Python objects may be identified, and if appropriate, relevant information may be viewed. The following image shows the Named Range example from Part 2 of this series; note that the Python editor has been extended to its maximum width to enable the data to be viewed more easily:
The following image shows the bar plot created earlier:
The display is the same for either the Python Object or Excel Values view, as that only applies to the grid. There is a right-click menu available for each cell of Python code in the Python Editor:
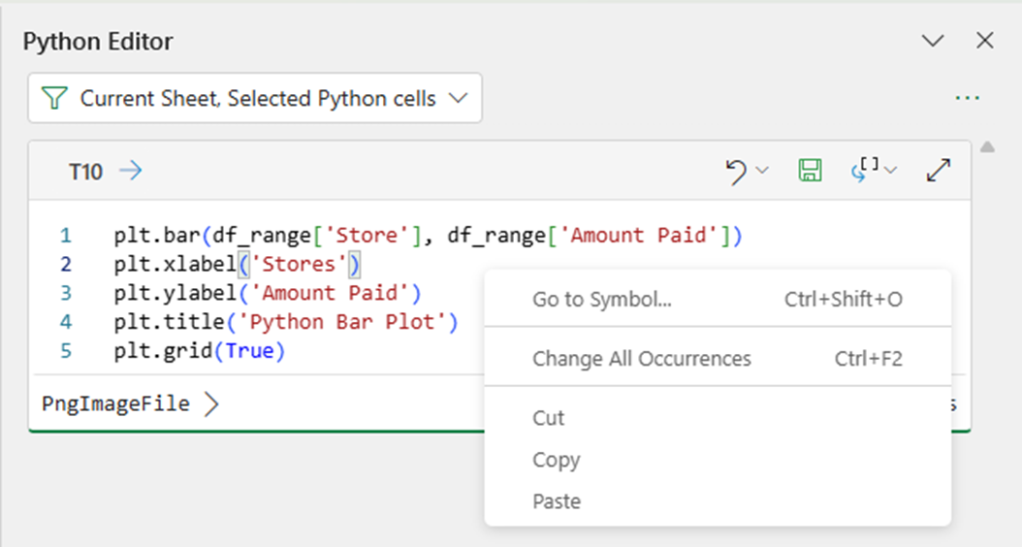
The top option, Go to Symbol…, is a way of searching for defined Python functions to see where they are used in more-complex Python code. It is also possible to view functions from the loaded library that are used in the cell by hovering over the function name:
The Python Editor is one of the most recent additions to Python in Excel and is therefore most likely to change as users build more-complex Python code and provide valuable feedback.
Since Python may be used to transform and clean data, the final example uses data traditionally transformed using Power Query. Whilst Power Query connectors remain the recommended method of importing data, it is possible to take the resulting query and work with the data in Python.
Using some basic accounting data, the following examples show how to append and merge with Python. For the purposes of clarity, do remember:
- append: Add rows to a data table.
- merge: Add columns (fields) to a data table.
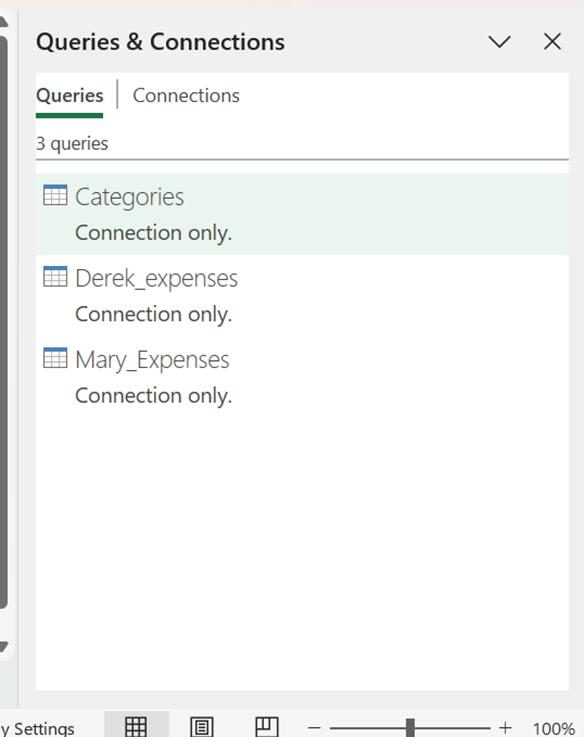
Using Power Query, two CSV files have been extracted:
To step out the process, DataFrames are created for each of these queries. The IntelliSense helps with this:
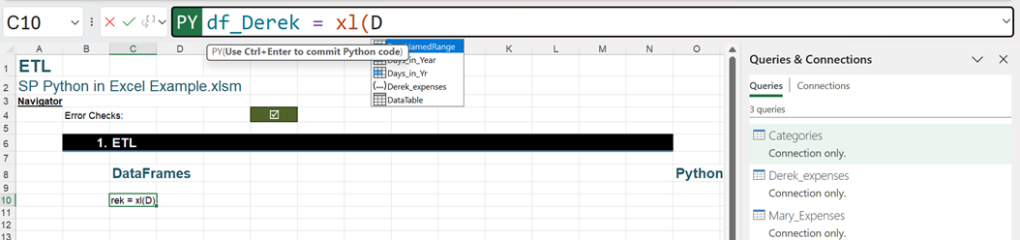
The Python code is:
df_Derek = xl(“Derek_expenses”)
This may be repeated for the other expense query:
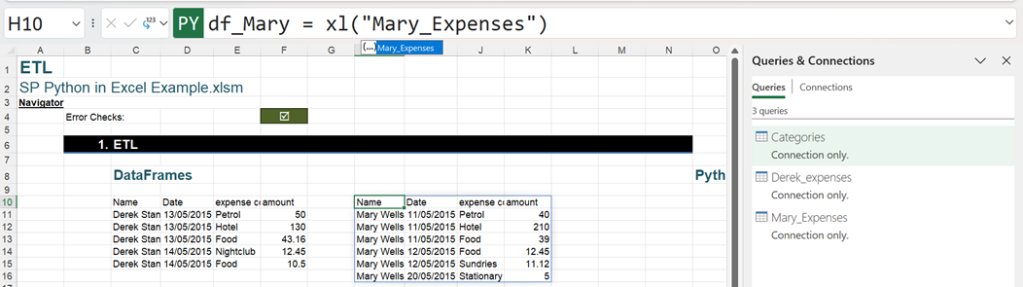
df_Mary = xl(“Mary_expenses”)
The pandas concat() function may be used to append the data:
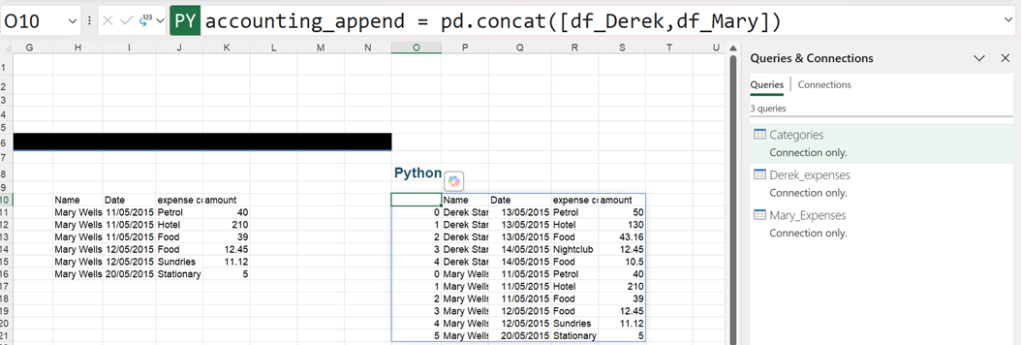
The Python code is:
accounting_append = pd.concat([df_Derek,df_Mary])
Merging data is simple, too, particularly if the column to be joined on has the same name. A new Table has been added, showing the position of the salespeople:
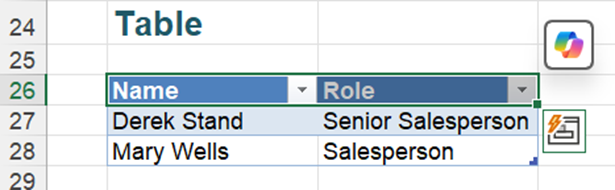
This Table has been given the name Roles and is identified with the DataFrame df_Roles:

The Python code is:
df_Roles = xl(“Roles[#All]”, headers=True)
Using pandas again, the merge() function may be used to merge this table with the accounting_append DataFrame:
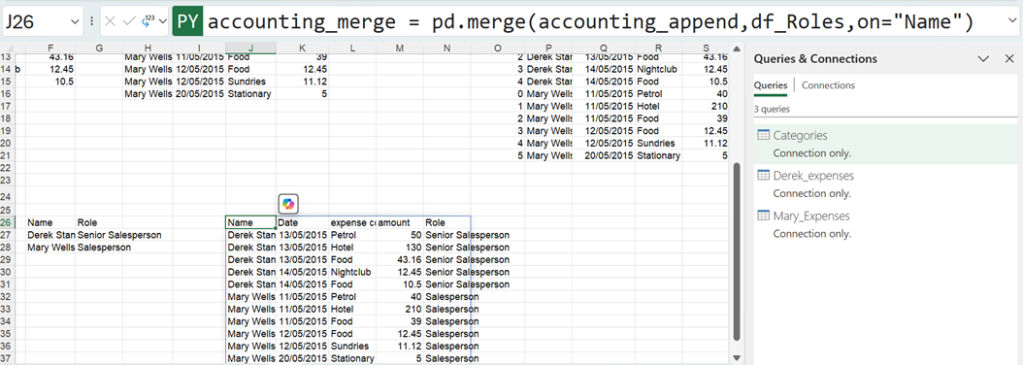
The Python code used is:
accounting_merge = pd.merge(accounting_append,df_Roles,on=“Name”)
In a business example, there would be no need to step out the process. It is easy to include all the steps in the code in the Python Editor:

The Python code used is:
- edit_accounting_append = pd.concat([xl(“Derek_expenses”),xl(“Mary_Expenses”)])
- edit_accounting_merge = pd.merge(edit_accounting_append,xl(“Roles[#All]”,headers=True), on=“Name”)
Whilst the code used in these examples is simple, it gives a taste of some of the things that can be achieved in Python in Excel.
— Liam Bastick, FCMA, CGMA, FCA, is director of SumProduct, a global consultancy specialising in Excel training. He is also an Excel MVP (as appointed by Microsoft) and co-author of Python in Excel: Unlocking Powerful Data Analysis and Automation Solutions. Send ideas for future Excel-related articles to him at liam.bastick@sumproduct.com. To comment on this article or to suggest an idea for another article, contact Oliver Rowe at Oliver.Rowe@aicpa-cima.com.
