

Pay raises for CFOs at US companies last year depended heavily on a company’s size and revenue growth.
Companies that grew by 50% or more in the three years prior to April 2012 increased their CFOs’ cash compensation by an average of 20.2%, according to a report by Verisight and The CFO Alliance.
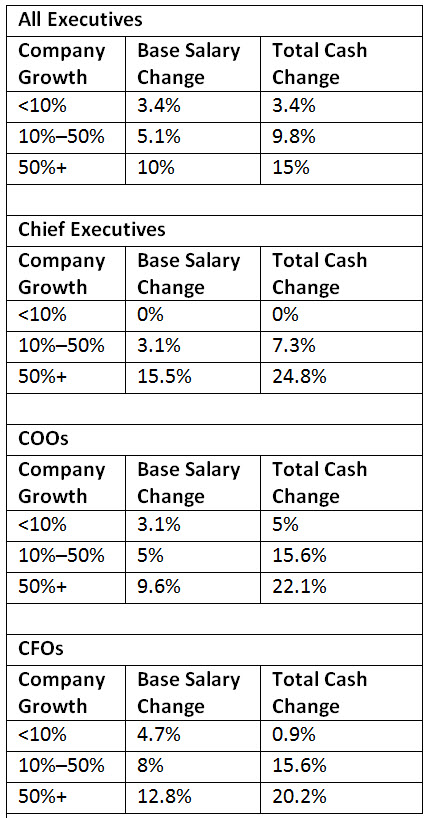
Companies with growth of 10% or less increased CFOs’ cash compensation by 0.9%. CFOs at companies that grew between 10% and 50% saw cash compensation rise 15.6%.
The study examined pay at 204 US companies for the 36 months before April 2012. The inaugural report focused on companies with revenue between $2 million and $2.6 billion.
Company size also played a key role in CFO pay. Those at companies with revenue of more than $200 million saw cash compensation go up 58.8%. Those at companies with revenue of more than $50 million saw cash compensation rise 9.1%.
For chief executives in low-growth companies, there was no increase in either base salary or total compensation, but chief executives in high-growth companies saw total compensation increase 24.8% and base salary increase 15.5% (see Exhibit 1 for details on executive pay as it relates to company growth).
The report predicts base salary increases for executives in 2013 to be 3%. Chief executive pay undergoes the most dramatic shift based on company growth, the report said.
Average pay for a CFO in the survey was $212,994, compared with average chief executive pay of $400,019 and average pay for chief operating officers at $248,001. Total compensation averaged $525,140 for CFOs at companies with at least $750 million in revenue. At companies with $25 million in revenue, the average was $248,921.
The percentage of pay outside of base salary increased based on the size of a company. For CFOs at companies with revenue of $50 million, 20% of pay came from short-term incentives. For CFOs at companies with revenue of $750 million, 28% of that $525,140 came from short-term incentives. For chief executives the percentage of non-base bay was higher: 24% for those at companies in the $50 million range and 38% for companies at $750 million.
Exhibit 1: Compensation Growth Compared to Organisation Sales Growth
Change in base salaries and total cash compensation over 36 months based on overall company growth, defined as a change in top-line revenue over 36 months.
Sources: Verisight and The CFO Alliance.
Related CGMA Magazine content:
“CFO Pay Increases, but CEO Pay Climbs More”: CFOs make less than one-third of what CEOs do at S&P 500 companies, and the gap appears to be widening, mainly because of increases in variable compensation.
“More Financial Executives Are Getting Raises – and the Raises Are Bigger”: Data from surveys in the US and elsewhere showed that pay increases were more common in 2012 and that the raises on average were bigger.
—Neil Amato (namato@aicpa.org) is a CGMA Magazine senior editor.
