


Decarbonisation is no longer just about policy statements or annual reports. Many organisations now integrate decarbonisation into their daily operations, confronting it as a core business challenge that demands immediate attention.
For management accountants, it is also moving centre stage in financial decision-making. Businesses, under pressure to meet their own sustainability goals, are asking suppliers to prove they operate sustainably. Regulators are tightening disclosure rules to tackle pollution, and investors want credible actions that protect long-term value.
One industry bearing the brunt of decarbonisation pressures is ports and logistics. Ports are energy-intensive operations, with cranes lifting containers, fleets of straddle carriers moving containers across the yard, and refrigerated storage units running continuously. Each container that moves through a port generates emissions not only within the terminal but also along its wider journey, whether carried on the road, by rail, or handled at customer locations through unpacking and onward transport.
The case company for our CIMA-sponsored research is DP World Southampton, part of the DP World Group (see the sidebar “About DP World Southampton” at the end of this article). Its size, complexity, and early adoption of decarbonisation measures make it a strong case study for examining how management accounting can be applied to environmental costs.
Costing emissions
DP World Southampton’s finance team applied activity-based costing (ABC) principles to its emissions data. Costing carbon directly allowed it to compare the economics of investing in emission-reducing measures against alternatives, such as purchasing carbon offsets.
Analysis of the team’s approach demonstrates that management accountants should avoid relying on average cost figures. As a barometer for the cost of sustainable operations, average costs can be misleading. Using marginal abatement cost (MAC) instead focuses on the additional cost of reducing one unit of carbon. By treating emissions as a cost pool, allocated and managed like other overheads, carbon becomes a visible and actionable financial element.
Extending ABC principles to carbon costing
ABC links overhead costs to the activities that generate them, rather than spreading them with a single basis across all services. A repair shop, for example, supports many different assets in a terminal, from cranes to straddle carriers. ABC allows those costs to be allocated according to, for example, the actual hours of maintenance each machine requires.
The same principle applies to environmental costs. Emissions are not a vague overhead to be absorbed at the company level but are the outcome of specific activities. Moving containers with yard vehicles, operating cranes, or powering refrigerated units all generate measurable emissions.
By identifying carbon-intensive activities, accountants can highlight where operational changes deliver the greatest emission reduction for each unit of currency invested. This reframes sustainability from being a corporate social responsibility exercise into a set of quantifiable cost drivers that can be analysed, managed, and improved.
In examining DP World Southampton’s use of ABC accounting, our research involved five steps:
1. Choosing the unit of account
The first step was to agree on the right unit of account. At DP World Southampton two activities dominate operations. One is loading and unloading containers from vessels. The other is transferring containers to and from trucks and trains. Both activities can be expressed using the same common denominator, the 20-foot equivalent unit or TEU, which represents a standard container. Using TEU as the unit of account allows emissions and costs to be measured on a per-container basis. This provides managers with a clear and comparable view of performance.
2. Tracking the inputs
The next step was to track the inputs that drive emissions. The focus was on four main categories of operating expenditure: electricity, fuel in the form of diesel and hydrotreated vegetable oil (HVO), water, and refrigerants. Each input has a measurable physical unit such as kilowatt hours, litres, cubic metres, or kilograms.
These inputs were then converted into kilograms of carbon dioxide equivalent (kgCO₂e) using emission factors — see the table “Emission Conversion Factors”.
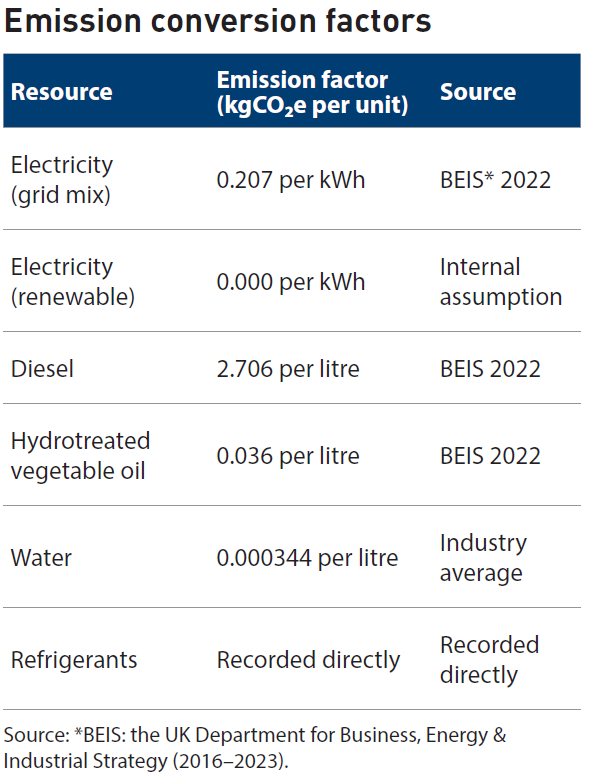
These emission factors, as applied to each input, translate physical quantities into a common unit of measurement, ie, kgCO₂e. This makes it possible to compare very different resources on the same basis and ensures that the footprint calculation is consistent and transparent. For example, 1,000 litres of diesel multiplied by the factor of 2.706 results in 2,706 kgCO₂e.
3. Calculating the footprint
In 2023, DP World Southampton recorded the resource use shown in the table “Emissions by Input”. The figures have been adjusted for confidentiality but remain representative of a typical port of similar size and operations.
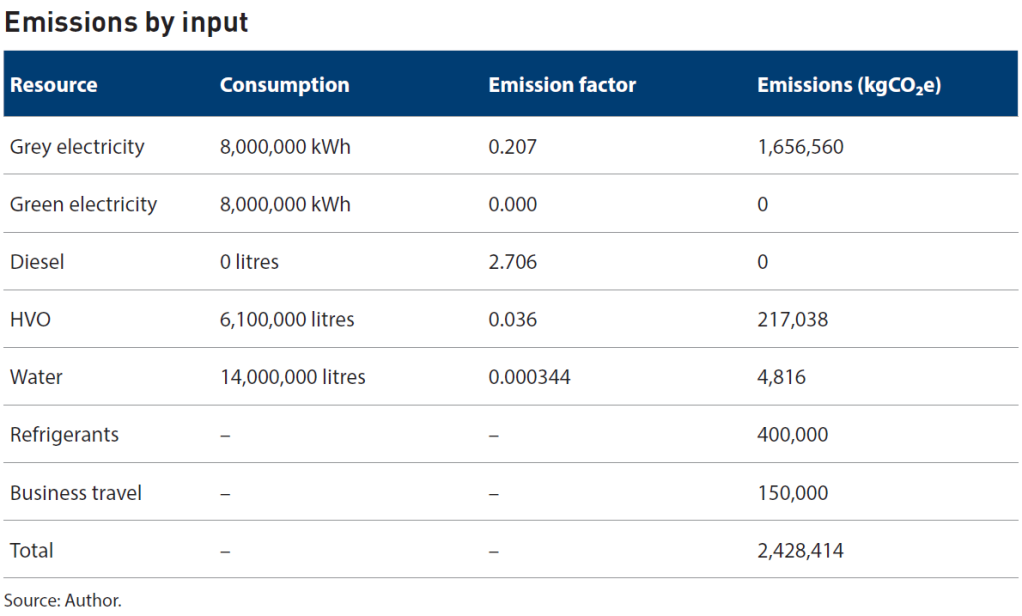
Each input was converted into emissions. Consumption figures were multiplied by their respective emission factors to give results in kgCO₂e. For example, 8 million kilowatt hours of grey electricity (ie, from nonrenewable sources such as fossil fuels) at a factor of 0.207 produces 1,656,560 kgCO₂e. Adding across all categories gives a total footprint of approximately 2.4 million kgCO₂e for 2023.
Emissions intensity
The terminal’s annual throughput in 2023 was around 2 million TEUs. Dividing the total emissions of 2,428,414 kgCO₂e by this volume gives an intensity of 1.21 kg per TEU. This result is striking when set against a 2024 academic study on the Port of Vigo, Spain, which reported an average of about 15 kilograms per TEU for comparable terminals. The sharp difference can be explained by DP World Southampton’s move from diesel to HVO and its use of renewable electricity for half of its power needs.
4. Scenario comparison
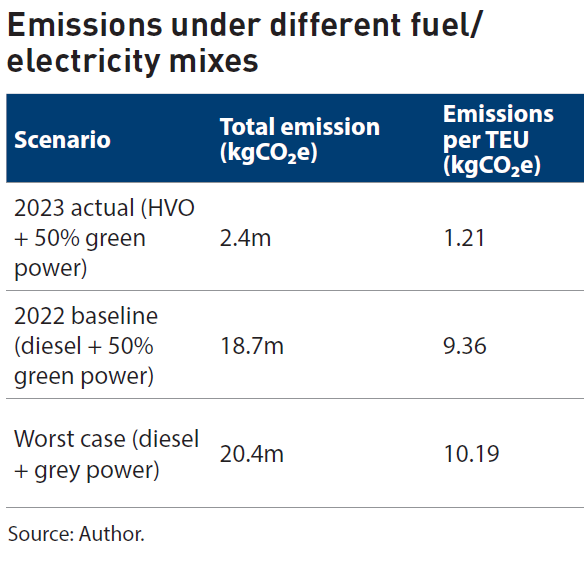
Emissions under different fuel and electricity mixes are shown in the table “Emissions Under Different Fuel/Electricity Mixes”. In 2023, switching entirely to HVO and sourcing half of the port’s electricity from renewables reduced total emissions to 2.4 million kgCO₂e (1.21 kgCO₂e per TEU). By contrast, the 2022 baseline using diesel (instead of HVO) with the same electricity mix produced 18.7 million kgCO₂e (9.36 kgCO₂e per TEU). A worst-case reliance on diesel and grey electricity would have pushed emissions to 20.4 million kgCO₂e (10.19 kgCO₂e per TEU). Overall, the 2023 changes cut emissions by about 88% compared with the previous worst-case scenario.
The cost-per-kg puzzle
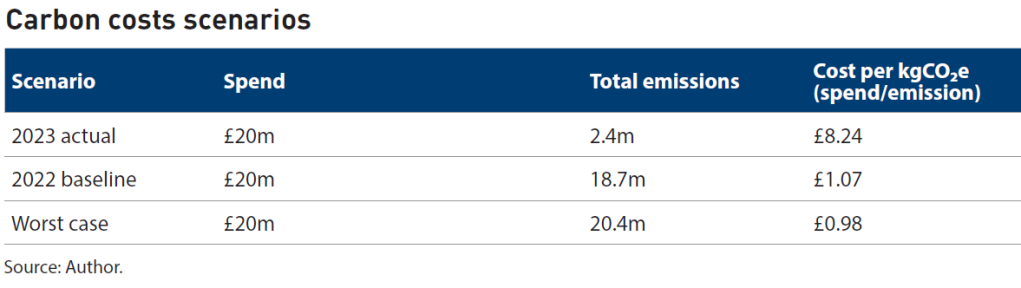
In 2023, DP World Southampton spent around £20 million on energy, fuel, refrigerants, and water (which was broadly similar to the prior year). What changed was the emissions output. Cleaner operations (HVO fuel and green electricity) cut emissions to just 2.4 million kgCO₂e, compared with 18.7 million the year before.
When the same £20 million spend is divided by a much smaller carbon footprint, the average cost per kgCO₂e rises from £1.07 in 2022 to £8.24 in 2023 (see the table “Carbon Costs Scenarios”). This is the same average measure we referred to earlier, and it illustrates why that measure can be misleading. At first glance it could be mistaken for a higher cost of emissions. In reality, it signals improvement. The business is spending the same amount to operate as in 2022 but is producing far fewer emissions in 2023. A higher average cost per kgCO₂e is therefore evidence of cleaner operations, not inefficiency.
This insight matters. Boards weighing carbon offsets against operational investments, such as fleet electrification and renewable energy procurement, may see the increase as a warning sign. In context, the £8.24 spent on electricity, diesel, HVO, and refrigerant gas in 2023 generated only 1 kgCO₂e. Every £1.07 spent in 2022 created the same amount. The efficiency lies in producing far less carbon per pound (ie, currency) spent. Accountants play a central role in presenting this evidence of progress to stakeholders.
5. Key decision metric — marginal abatement cost
When companies look at cutting carbon, average costs per kilogram can be misleading. What really matters is the marginal abatement cost (MAC), which shows the extra cost of removing one more unit of carbon through a specific change.
For the case company, a diesel cost for example of £1.10 per litre produces 2.706 kgCO₂e. By contrast, HVO costing £1.40 per litre produces only 0.036 kgCO₂e. The difference in emissions is 2.706 — 0.036 = 2.67 kg per litre. In other words, every litre of HVO used instead of diesel avoids about 2.67 kg of emissions.
The switch adds £0.30 per litre in fuel cost. That is, HVO is £0.30 more expensive than diesel. To find the MAC, we divide the extra cost by the emissions avoided:
MAC = £0.30 ÷ 2.67 = £0.11 per kgCO₂e reduced
Each kgCO₂e saved by switching to HVO costs just £0.11.
Why is this formula so important? Because MAC tells decision-makers whether cutting emissions directly is cheaper than alternatives such as buying carbon offsets. It translates sustainability choices into a clear cost per unit of carbon saved, making it the single most useful metric for comparing investments and guiding boardroom decisions.
Why compare with offsets?
Offsetting allows a company to finance emission reductions elsewhere, such as tree planting, renewable energy projects, or carbon capture schemes. Because offsets are traded in established markets, usually between £0.15 and £0.25 per kgCO₂e (according to the UK Green Building Council), they provide a useful benchmark. For this analysis we use £0.18 per kg as the reference price. DP World Southampton now issues carbon inset credits — representing verified emission reductions within its own supply chain — to importers. These credits have reporting value but no published market price. Offsets therefore remain the most practical benchmark for comparison.
The MAC for switching from diesel to HVO is £0.11 per kgCO₂e, compared with the offset benchmark of £0.18. Since £0.11 is lower, HVO is cheaper than buying carbon offsets. It also avoids reputational risk because stakeholders identify cutting emissions at source as a far more proactive step than relying on offsets. The decision rule that helps managers decide whether to abate emissions or purchase offsets is shown in the flow chart “Decision Rule for Emission Reduction Investments”.
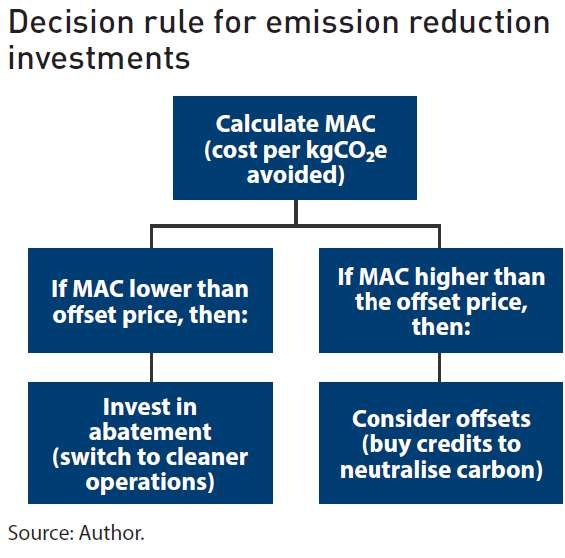
By presenting both the carbon outcome and the financial impact, accountants can strengthen the investment case for boards and senior managers. The MAC shows the cost of each kgCO₂e avoided, while financial analysis highlights whether the switch improves operating costs, protects margins, or reduces future compliance risks. Taken together, these measures turn sustainability decisions into straightforward business choices.
DP World Southampton: Emission-producing activities
Instead of treating carbon as one large overhead, the DP World Southampton finance team broke it down by activity. The bar chart, “Activity-Based Emissions Breakdown”, shows that refrigerated containers (reefers) and their associated gantry power account for about 31% of emissions, making them the single-largest contributor. Cranes are the next major source at around 24%, followed by lighting, workshops, and small vehicles at about 20%. Yard vehicles such as straddle carriers, often assumed to dominate, contribute only about 5% of emissions.
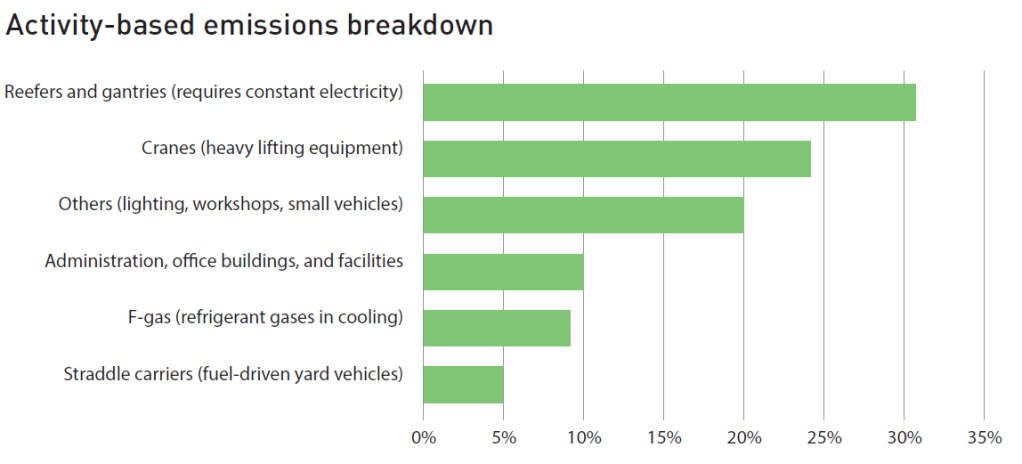
This breakdown highlights where carbon costs really sit. Reefers, which consume electricity constantly to maintain cooling, account for a relatively small share of throughput yet are disproportionately carbon-intensive. That makes them a candidate for a carbon surcharge on reefer customers, aligning price with true environmental cost.
Straddle carriers, although responsible for just 5% of total emissions, remain strategically important because they are fuel-driven. Switching them from diesel to HVO delivered the single biggest reduction in emissions between 2022 and 2023. For example, a straddle carrier consuming 200 litres of fuel per day produces about 541.2 kgCO₂e using diesel, but only about 7.2 kgCO₂e using HVO. Over a year, that saves around 195 tonnes of CO₂e per vehicle. With dozens of straddles operating daily, this explains why fuel switching has been the most impactful abatement measure so far and why it should be the first target for ports of similar scale. The MAC of such a switch is also likely to be lower than penalties faced under regulatory schemes such as the EU Emissions Trading System or the UK’s upcoming Carbon Border Adjustment Mechanism.
By putting emissions into the same analytical framework as financial costs, ABC makes carbon visible, measurable, and comparable. This allows green projects to be ranked and justified with the same logic applied to any other capital decision. What was once an invisible externality becomes a clear cost driver, embedded in pricing, planning, and investment choices.
About DP World Southampton
DP World Southampton is the second-largest deep sea container terminal in the UK and handles close to 2 million 20-foot equivalent container units (TEUs) each year.
The terminal is a vital link in the UK’s national supply chain, unloading containers from vessels and transferring them onto trucks and rail. Maersk is one of the global shipping companies that calls at the terminal through an associate service. Major customers such as Maersk have public targets to cut emissions across their value chain, including Scope 3, and they are seeking programmes that require lower carbon operations at and around ports. This translates into expectations for port partners to show credible progress on emissions. DP World Southampton has begun to respond with practical measures, including a carbon inset programme (ie, within the supply chain) for import containers and a modal shift scheme that rewards the use of rail over road.
As part of the global DP World group, DP World Southampton plays a critical role in supply chains and has been one of the first ports in the UK to adopt low-carbon fuels and renewable power at scale.
Surendranath Rakesh Jory, Ph.D., is associate professor of finance at the University of Southampton in the UK. This article has benefited from the contributions of Shobija Luxmikanthan, management accountant at DP World Southampton, and Alex Hunter, port finance manager at DP World Southampton. The research team also includes Professor Martin Solan; Ahmad Maaitah, Ph.D.; Irene Ruiz Espejo; and Beatrice Craycraft from the University of Southampton. To comment on this article or to suggest an idea for another article, contact Oliver Rowe at Oliver.Rowe@aicpa-cima.com.
LEARNING RESOURCES
Online ESG and Sustainable Financial Strategy
This programme allows finance leaders to master ESG, net zero, and sustainable investment. Combining Oxford Saïd’s academic excellence with AICPA and CIMA’s industry insights, you’ll finish with a Sustainability Transformation Plan — a practical blueprint to drive impact and long-term growth.
COURSE
Oxford Sustainability Reporting and ESG Data Management
This programme gives you the skills to master global reporting frameworks, harness ESG data, and prepare your organisation for assurance readiness.
COURSE
MEMBER RESOURCES
Articles
“With Greenhouse Gas Reporting, Sizable Gaps Persist”, FM magazine, 5 September 2025
“CIMA Welcomes Exposure Drafts on UK Sustainability Reporting Standards”,
FM magazine, 27 June 2025
“How ESG Reporting Can Drive Value Creation”, FM magazine, 4 December 2024
Research
Carbon Costing and Control Through Activity-Based Emissions Accounting, AICPA & CIMA, 12 September 2025
Exploring the Role of Management Accounting in Building Sustainability and Resilience,
AICPA & CIMA, 10 August 2025
