


We have been told for years that we live in the Information Age: Information is gathering momentum and pace; it’s growing exponentially. Yet less than 10% of the data companies currently hold is used to inform decision-making.
The escalation of data poses its own set of problems — the danger is we get lost in a sea of data that delivers no value whatsoever, bamboozled by the proliferation of smart technology and endless possibilities that send businesses down resource-sapping rabbit holes without any useful or definable output.
The basic idea behind Big Data is that everything we do is increasingly leaving a digital trace that we can use and analyse to become smarter. US retailing giant Wal-Mart Stores Inc. handles more than 1 million customer transactions an hour and imports them into databases estimated to contain more than 2.5 petabytes of data.
Wal-Mart uses data to understand what is trending in social media, as well as buying patterns amongst similar types of customers and what competitors are charging in real time. The company changed its free shipping policy based on Big Data analytics, increasing the minimum qualifying online order from $45 to $50. Meanwhile, Amazon has recently patented “anticipatory shipping”. The online retailer has become so good at predictive analytics that it believes it knows what you will buy before you buy it and can ship an item towards you even before it is in your shopping cart.
Companies such as Amazon and Wal-Mart may enjoy a competitive advantage because of the data they have access to, but there is probably more than enough data in your own company to tap into without eye-watering budgets as long as you focus on SMART data, not Big Data.
The SMART model — start with strategy, measure metrics and data, apply analytics, report results, transform your business — allows you to cut through the chaos. Step back from the hype and learn the techniques to convert raw information into real business results.
The SMART model at work
Instead of starting with the data, start with your business objectives and what you are specifically trying to achieve. This will automatically point you towards questions that you need to answer, which will narrow data requirements into manageable areas.
Once you know what you are trying to achieve and you are clear on what SMART questions need to be answered, then work out how you can access that information so you can measure metrics and data.
The next step is to apply analytics, extracting useful insights from the data that can help you answer strategic questions. The data themselves are meaningless unless they help you to execute your strategy and improve performance.
But the insights alone are useless unless you report results. The mistake that is too often made by data scientists is to bury these insights in 50-page reports that no manager or executive has time to read. Ideally, results should also be reported in a single-page infographic.
When you approach data and analytics from this narrower, more practical perspective, you can transform your business, understanding your customers better, improving and optimising business processes, and driving performance.
I worked with a telecom company whose business objective was to reduce customer churn. Executives knew they had a lot of data and ran analytics on some of it but had never looked at how people called each other. They didn’t know whether their customers made mainly inbound or outbound calls, how long they spoke, or what times of the day were most popular.
By mining those data and applying analytics, they found that one particular calling pattern was much more associated with churn than the rest. The data analysis showed that there was a type of customer who moves more frequently than others. By identifying that segment of the market, they could target those customers with special offers that would entice them to stay. By analysing traditional structured data a little differently, they were able to extract commercially significant insights that increased profit.
SMART data can transform the relationship of a business with its customers. They can also transform the way a business thinks about itself.
SMART questions, smart answers
Asking SMART questions can lead a company to change its business model entirely.
Rolls Royce asked itself what its customers needed rather than focusing simply on what the company provided. That led it from only manufacturing aircraft engines to monitoring the engines, too, using thousands of sensors to identify issues before they arose.
Now Rolls Royce sells the engines and offers to monitor them, charging customers based on engine usage time, and repairs and replaces parts if there is a problem. So the client effectively buys a dynamic servicing option, and this servicing now accounts for 70% of the civil-aircraft engine division’s annual revenue.
General Electric Co. is another company that has transformed its business away from its traditional manufacturing roots using Big Data analytics. Its gas turbines are now smart turbines. It has collected 100 million hours of operational data, and these “intelligent” machines communicate their operating statistics through 400 sensors on each turbine, allowing adjustments to be made to improve efficiency and reduce wear and tear.
Using operational data from sensors on a range of machinery and engines, GE applies analytics to identify patterns and deliver commercially relevant insights. Like Rolls Royce, GE provides additional services tied to its products designed to improve real-time efficiency and minimise downtime caused by parts failures.
As well as transforming a company’s relationship with its customers, Big Data is increasingly being used to optimise business processes.
A collaborative exercise
To reap the benefits of Big Data, you don’t have to collect everything and produce the biggest, most complex database in the world. The aim is actually the opposite — to get clear about the data you need and build the smallest, most straightforward database in the world.
The truth is we are often so mesmerised by the data that we forget the question is much more important than the answer the data may provide.
As a rule of thumb, start with internal data and structured data, which are usually easier and cheaper to analyse than unstructured or semi-structured data.
But asking the right questions and finding the right data to answer them is not in itself enough. Leaving the reporting to analysts and designers alone is as unproductive as leaving it to the executives. There needs to be collaboration and interaction between the people creating the results and the people who need the results to make decisions.
Consumer products manufacturer Procter & Gamble has chosen to institutionalise data visualisation as a management tool. The company put visual displays of key information on more than 50,000 desktops and created “business spheres”, which are basically information dashboards that have all the same technology and data visualisation protocols in place.
P&G has ensured information is presented in a common way across the whole company. The company has initiated a set of seven “business sufficiency models” that specify what information is used to address particular problem domains. If a P&G executive is focused on supply-chain issues, the sufficiency models specify the key variables, how they should be displayed visually, and sometimes even the relationships between the variables and forecasts based on the relationships.
The uniformity means everyone is on the same page. Once the data are understood, executives from any division, any brand, or in any country can quickly and easily interpret the data. That means they spend less time trying to understand the data and more time putting them to use and making better decisions. It also prevents people from hijacking the data and presenting them in a way that supports their pet theory.
Never forget that data analytics is useful only if you make sure the right people get the right information in the right format so they can make the right decisions more often.
Linking Big Data with strategic goals
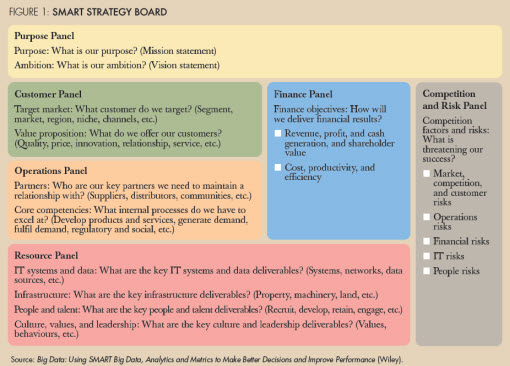
To help companies get clear on their strategic data needs, I’ve developed a framework I call the SMART strategy board. It helps you step back and ask the right questions to ensure your Big Data initiatives are linked to your strategic needs.
There are six panels in the strategy board (see Figure 1):
- The Purpose Panel contains your mission statement, which concisely states why your business exists, and your vision statement, which explains what you want your business to be in the future.
- The Customer Panel prompts you to consider how much you know about the customers your strategy is targeting and what you may need to find out in order to deliver on your strategic objective. It should include your target market and your value proposition.
- The Finance Panel is designed to make you consider how much you know about the financial implications of your strategy. How does your strategy generate money? Are you confident your business model is accurate?
- The Operations Panel makes you think about what you need to do internally to deliver your strategy. Which suppliers, distributors, and partners are crucial? Do you currently work with them, or do you have to establish new relationships? And, secondly, in what core competencies will you need to excel if you are going to execute your chosen strategy?
- The Resource Panel prompts you to consider what resources you need to deliver your strategy and what you may need to find out. There are four components: IT systems and data; infrastructure; people and talent; and values and leadership.
- The Competition and Risk Panel assesses the competition you will be up against and what risks you may face along the way. It’s the perspective that is most often missing from strategy maps, and yet it poses a serious potential threat to successful strategic execution.
Bernard Marr (bernard.marr@ap-institute.com) is chief executive of the Advanced Performance Institute and author of Big Data: Using SMART Big Data, Analytics and Metrics to Make Better Decisions and Improve Performance (Wiley).
Know your data type
It’s important to understand the various types of data that can now be analysed for insight:
- Structured data: Data located in fixed fields within a defined record or file, such as spreadsheets and relational databases.
- Unstructured and semi-structured data: Images, text documents, and social media posts.
- Internal data: Data that you can access only from within your own business.
- External data: Data that have been created or generated outside your business that you do not own or have access to;; there may be a cost to access them.
